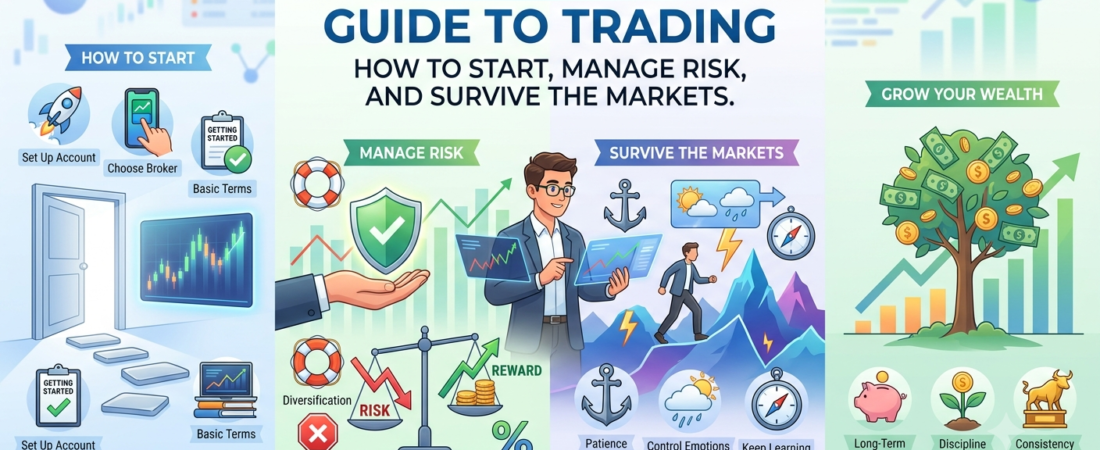
The ultimate beginner’s guide to trading looks incredibly simple from the outside. You buy a stock, the price goes up, you sell it, and you pocket the profit. Social media is flooded with videos of young traders sitting by hotel pools, laptop in hand, claiming they made thousands of dollars before breakfast.
But if you speak to anyone who has actually traded for more than a few months, they will tell you a completely different story.
The reality is that trading is one of the toughest endeavors you can embark on. It is a game of probability, psychology, and strict discipline. According to various broker statistics, between 70% and 90% of retail traders lose money. Why? Because they treat the markets like a casino rather than a business.
If you are reading this, you are likely at the very beginning of your journey. You want to learn how the markets work, how to protect your hard-earned money, and how to build a consistent trading framework.
This guide is designed to be your compass. We will strip away the confusing financial jargon, break down complex market dynamics into plain English, and give you a realistic, step-by-step roadmap to becoming a knowledgeable trader. No fluff, no get-rich-quick promises—just real, actionable trading fundamentals.
What Is Trading?
At its core, trading is the act of buying and selling financial assets over a relatively short period with the primary goal of making a profit.
Unlike buying a house or a piece of land to hold for twenty years, a trader looks at price movements that happen over days, hours, or even minutes.
Think of trading like being a local merchant. A merchant buys goods from a wholesaler at a lower price and sells them to retail customers at a higher price to make a profit. In the financial markets, the “goods” are stocks, currencies, cryptocurrencies, or commodities.
The fundamental principle driving trading is liquidity and price fluctuation. Prices of financial assets are constantly moving because of a continuous tug-of-war between buyers and sellers. When there are more buyers than sellers, the price goes up. When there are more sellers than buyers, the price goes down. As a trader, your job is to analyze these movements, form a thesis on where the price will go next, and position yourself to benefit from that movement.
How Trading Works: The Mechanics behind the Screen
When you sit in front of your laptop and click the green “Buy” button on your trading dashboard, what actually happens? It feels instantaneous, but behind the scenes, a highly organized financial machinery goes to work.
The Role of the Broker
You cannot buy a stock directly from the New York Stock Exchange (NYSE) or the London Stock Exchange (LSE). You need a middleman. This middleman is your broker. Your broker provides you with a trading platform, routes your orders to the public markets, and ensures that your trades are executed at the best available price. In exchange for this service, brokers charge fees, commissions, or a “spread” (which we will cover later).
Market Orders vs. Limit Orders
When you want to enter a trade, you generally have two main ways to tell your broker to do it:
- Market Order: This tells your broker to buy or sell the asset immediately at whatever the current market price is. It guarantees that your trade will happen right away, but it does not guarantee the exact price you will get.
- Limit Order: This tells your broker you only want to buy or sell if the asset hits a specific price. For example, if Apple stock is trading at $180, you can set a limit order to buy it only if it drops to $175. This guarantees your price, but your trade will only execute if the market actually drops to that level.
Bid, Ask, and the Spread
Every financial asset has two prices listed at any given second:
- The Bid: The highest price a buyer is currently willing to pay for that asset.
- The Ask (or Offer): The lowest price a seller is currently willing to accept for that asset.
The difference between these two prices is called the spread. For example, if you look at a currency pair like EUR/USD and the Bid is 1.0850 while the Ask is 1.0852, the spread is 0.0002 (or 2 pips). The spread essentially acts as a transaction cost. When you buy an asset using a market order, you buy it at the higher Ask price. When you sell it, you sell it at the lower Bid price. Highly popular assets have very tight spreads, meaning it costs less to trade them.
Trading vs. Investing: Knowing the Difference
Many people use the terms “trading” and “investing” interchangeably, but they represent two completely different philosophies, timelines, and psychological approaches to the financial markets. Understanding which path you are taking is vital for your success.
| Feature | Trading | Investing |
|---|---|---|
| Time Horizon | Short-term (minutes, hours, days, weeks) | Long-term (months, years, decades) |
| Primary Tool | Technical Analysis (charts, price patterns, indicators) | Fundamental Analysis (company earnings, balance sheets, macroeconomic health) |
| Profit Mechanism | Benefiting from short-term price fluctuations | Compounding returns, corporate growth, and dividends |
| Risk Profile | High frequency of risk; relies on strict stop-losses | Lower short-term risk; filters out daily market noise |
| Activity Level | Active, daily monitoring required | Passive; periodic portfolio adjustments |
The Investor’s Mindset
An investor wants to buy a piece of a great business or an entire economy. If you invest in an index fund or a stock like Microsoft, you are doing so because you believe that over the next five to ten years, the company will grow its revenue, innovate, and become more valuable. You do not care if the stock drops 5% next Tuesday because of bad weather or a random news headline. You hold through the volatility, confident in the long-term value.
The Trader’s Mindset
A trader does not care if a company is going to change the world in ten years. A trader cares about what the price is going to do over the next ten hours. Traders thrive on volatility—the rapid upward and downward swings in price. If an asset’s price doesn’t move, a trader cannot make money. Traders use strict stop-losses to protect their capital, cut their losses quickly when they are wrong, and take their profits as soon as their target price is reached.
1. Scalping (Seconds to Minutes)
Scalpers are the speed-demons of the trading world. A scalper enters and exits trades within a matter of seconds or minutes. Their goal is to capture tiny fractions of price movements over and over again throughout the day.
- The Pros: You never hold trades overnight, meaning you can sleep peacefully without worrying about bad news dropping while you sleep.
- The Cons: It requires absolute focus, lightning-fast execution, and can be incredibly stressful. You also pay a lot in transaction fees due to the high volume of trades.
2. Day Trading (Hours)
Day traders buy and sell assets within a single day. A day trader might buy a stock at 10:00 AM after seeing a strong morning breakout pattern and sell it at 3:30 PM before the market closes.
- The Pros: Like scalping, there is zero overnight risk. You get clear closure at the end of every single trading day.
- The Cons: It is a full-time job. You cannot easily day trade if you have a regular 9-to-5 career because you need to monitor the charts actively during market hours.
3. Swing Trading (Days to Weeks)
Swing trading is often considered the ideal style for beginners, especially those who balance a full-time job or university studies. Swing traders look for medium-term price trends (or “swings”) that develop over several days or weeks. You analyze your charts in the evening, set your entry and exit orders, and let the market play out over the coming days.
- The Pros: It requires much less time sitting in front of a screen. It allows you to capture much larger percentage moves in price.
- The Cons: You hold trades open overnight and over the weekends. If a company releases disastrous news on a Sunday evening, the stock might “gap down” on Monday morning, bypassing your risk targets.
4. Position Trading (Months)
Position traders are the closest relatives to investors. They look at major macroeconomic trends and hold their positions for several months or even a year. For example, a position trader might notice that global interest rates are falling, leading them to hold a long position in gold for nine months to ride a massive structural uptrend.
- The Pros: Very low stress, very low time commitment, and highly strategic.
- The Cons: Requires significant capital because your money is locked up in long-term positions, and you must have immense patience to ride out large temporary pullbacks.
Types of Financial Markets to Trade
As a trader, you are spoiled for choice when it comes to what assets you can trade. Each market has its own distinct personality, hours of operation, and rules of engagement.
The Stock Market
This is where pieces of publicly listed companies (like Apple, Tesla, or Barclays) are traded.
- Characteristics: Highly regulated, deeply liquid, and heavily influenced by corporate earnings reports, sector trends, and economic data.
- Hours: Standard business hours (e.g., 9:30 AM to 4:00 PM EST in the USA).
The Forex Market (Foreign Exchange)
Forex is the global marketplace where national currencies are traded against each other in pairs, such as EUR/USD (Euro vs. US Dollar) or GBP/USD (British Pound vs. US Dollar).
- Characteristics: The largest and most liquid financial market in the world, trading over $7 trillion a day. Because it is so massive, it is incredibly difficult for any single entity to manipulate prices.
- Hours: Open 24 hours a day, 5 days a week.
The Crypto Market
The newest frontier in trading, consisting of digital currencies like Bitcoin (BTC), Ethereum (ETH), and thousands of altcoins.
- Characteristics: Known for extreme volatility. It is not uncommon for a cryptocurrency to move 10% or 20% in a single day. This offers massive profit potential but equally massive risk.
- Hours: Open 24 hours a day, 7 days a week, 365 days a year.
The Commodities Market
This is where raw materials and agricultural products are traded. Think precious metals (Gold, Silver), energy (Crude Oil, Natural Gas), and soft commodities (Coffee, Wheat, Sugar).
- Characteristics: Heavily driven by global supply and demand dynamics, geopolitical tensions, and weather events.
Essential Trading Terminology for Beginners
Before you place your first trade, you need to speak the language of the markets. Here is a quick glossary of terms you will see every single day:
- Bull Market / Bullish: A market condition where prices are rising, and the overall sentiment is optimistic. Think of a bull thrusting its horns up into the air.
- Bear Market / Bearish: A market condition where prices are falling, and sentiment is pessimistic. Think of a bear swiping its paws down.
- Going Long: Buying an asset with the expectation that its price will rise, allowing you to sell it later for a profit.
- Short Selling (Going Short): Borrowing an asset to sell it at a high price today, with the plan to buy it back at a lower price in the future. This allows you to profit when a market is crashing.
- Leverage: Money borrowed from your broker to increase the size of your trading position. If you use 1:10 leverage, a $1,000 account allows you to control $10,000 worth of an asset. While leverage magnifies your profits, it magnifies your losses exactly the same way.
- Margin: The minimum amount of cash required in your account to open and maintain a leveraged trade.
- Pip: A “percentage in point.” It is the smallest price move that a given exchange rate makes, usually the fourth decimal place (0.0001) in Forex trading.
- Volume: The total number of shares, contracts, or coins traded during a specific period. High volume means high interest and cleaner price movements.
The Two Pillars of Analysis: Technical vs. Fundamental
To make an informed trade, you need a way to read the market and make a logical prediction. Traders rely on two distinct schools of thought: Technical Analysis and Fundamental Analysis.
Technical Analysis: Reading the Visual Story of Price
Technical analysts believe that all available information about an asset is already baked into its price. Therefore, they focus entirely on analyzing historic price charts, patterns, and mathematical indicators to predict future movements.
- Candlestick Charts: The standard charting style used by traders. Each “candle” shows you four data points for a specific timeframe: the Opening price, the Closing price, the High, and the Low (OHLC). A green candle means the price closed higher than it opened; a red candle means it closed lower.
- Support and Resistance: These are the horizontal boundaries on a chart. Support acts like a floor where buying pressure historically steps in to stop prices from falling further. Resistance acts like a ceiling where selling pressure steps in to stop prices from rising further.
- Moving Averages (MA): A line drawn on a chart that averages the price of an asset over a set period (like 50 or 200 days), helping you smooth out daily noise and clearly see the primary trend.
- RSI (Relative Strength Index): A popular momentum indicator that ranges from 0 to 100. If the RSI goes above 70, the asset is often considered “overbought” (potentially due for a drop). If it sinks below 30, it is considered “oversold” (potentially due for a bounce).
Fundamental Analysis: Looking at the Real-World Value
Fundamental analysts look outside the chart to evaluate the intrinsic value of the asset.
- In Stocks, this means studying a company’s balance sheet, debt levels, management team, and quarterly earnings reports.
- In Forex, this means tracking national interest rates, unemployment figures, GDP growth, and central bank speeches.
- In Crypto, this means looking at network adoption metrics, active wallet addresses, transaction fees, and developer activity.
Which one is better? The most successful traders don’t choose sides. They use a hybrid approach. They might use Fundamental Analysis to figure out what asset to trade, and then use Technical Analysis on the charts to find the exact perfect moment when to buy or sell it.
Step-by-Step Guide to Start Trading the Right Way
If you want to start trading without blowing up your bank account within the first week, you need to follow a structured, cautious roadmap. Here is how you do it step by step.
Step 1: Dedicate Capital You Can Afford to Lose
The first rule of trading survival is simple: Never trade with money you need for rent, bills, groceries, or emergencies. Trading involves real financial risk. If you are trading with your survival money, emotions will paralyze you, and you will make terrible, impulsive decisions. Treat your initial trading capital like money you spent on an educational course—if it disappears, your lifestyle should not change one bit.
Step 2: Choose a Reputable Broker
Do not just sign up with the first broker that sends you an ad on Instagram. Look for established, heavily regulated brokers in your region.
- USA: Look for brokers regulated by the SEC, FINRA, and NFA (e.g., Interactive Brokers, Charles Schwab, Robinhood).
- UK: Look for brokers regulated by the Financial Conduct Authority (FCA) (e.g., IG, Trading 211, Plus500).
- Canada/Australia: Look for IIROC (Canada) or ASIC (Australia) regulation.
Ensure the broker has low spreads, clear fee structures, reliable customer support, and an intuitive platform.
Step 3: Start with a Demo Account (Paper Trading)
Every reputable broker offers a Demo Account. This is a simulated trading environment loaded with virtual money, but it mimics the real, live market movements exactly.
Spend at least 1 to 3 months paper trading. Use this time to learn the software inside out, practice placing market and limit orders, understand how leverage works, and experience what it feels like to watch a trade move in real-time. If you cannot make money using free monopoly money, you will definitely not make money using your actual cash.
Step 4: Keep a Detailed Trading Journal
A trading journal is the single most powerful tool for self-improvement. Every time you enter a demo or live trade, write down:
- The asset and timeframe
- The exact reason why you entered the trade (What pattern or indicator did you see?)
- Your planned Stop-Loss and Take-Profit levels
- The emotional state you were in (Were you calm, anxious, or rushing?)
- The final outcome and what you learned
Over time, this journal will reveal your patterns. You will see exactly what strategies make you money and what bad habits are draining your account.
The Art of Risk Management: How to Never Blow an Account
Ask any professional trader what their job description is, and they won’t say “making money.” They will say “managing risk.” Successful trading is not about being right 100% of the time; it is about keeping your losses small when you are wrong, and maximizing your wins when you are right.
Initial Capital: $10,000
Max Risk Per Trade (1%): $100

Scenario A (Bad Risk Management): Risking 10% per trade ($1,000)
-> 5 consecutive losses = $5,000 lost (50% of account gone!)

Scenario B (Good Risk Management): Risking 1% per trade ($100)
-> 5 consecutive losses = $500 lost (Only 5% of account gone!)
The 1% Rule
This is the golden rule of retail trading risk. Never risk more than 1% of your total account balance on any single trade.
Let’s look at the math. If you have a $10,000 trading account, 1% of that is $100. This means that if your trade goes against you, you should exit the trade with a maximum loss of $100.
Why is this so important? Because markets can experience sudden streaks of bad luck. If you risk 10% per trade and hit a normal losing streak of 5 trades in a row, you have lost 50% of your account. To recover from a 50% loss, you need to make a 100% return just to get back to even. If you use the 1% rule, 5 losses in a row only knocks out 5% of your capital, leaving you perfectly safe and ready to fight another day.
The Stop-Loss Order: Your Ultimate Safety Net
A Stop-Loss is an automatic order placed with your broker to sell an asset when it reaches a specific price point. It is your ultimate insurance policy. Before you click “Buy,” you must decide exactly where your trade thesis becomes invalid.
If you buy a stock at $50 expecting it to rally to $60, you might place a stop-loss at $48. If the stock drops to $48, the broker instantly shuts down the trade. You accept a $2 loss per share, shake hands with the market, and move on. Never move your stop-loss wider during a trade because you “hope” it will turn around. Hope is a terrible strategy in the markets.
The Risk-to-Reward Ratio (R:R)
Always aim for trades that offer an asymmetric risk-to-reward ratio. A healthy baseline is 1:2. This means that for every $1 you risk, you stand to make $2 in profit.
If you maintain a 1:2 risk-to-reward ratio, you can actually be completely wrong 60% of the time and still make a steady profit!
- 10 Trades total
- 6 Losses at $100 each = -$600
- 4 Wins at $200 each = +$800
- Net Profit: +$200
This is the secret realization of trading: consistency is driven by math and mechanics, not by predicting the future perfectly.
Trading Psychology: Controlling the Internal Demons
You can have the most expensive charting software, the best computer setup, and a flawless strategy, but if you do not control your mind, you will fail. Trading acts like a giant magnifying glass on human emotion. Two primary emotional states derail most beginners:
Fear of Missing Out (FOMO)
You open your charts and see that Bitcoin or a tech stock is currently up 15% in the last two hours. A massive green candle is shooting up the screen. You feel a sudden surge of adrenaline. You think, “I’m missing the move! I need to buy right now!”
This is FOMO. When you buy an asset after a massive rally has already happened, you are buying at the absolute peak of exhaustion. Right after you buy, the smart money takes profits, the price plummets, and you are left holding a losing position.
- The Rule: If you miss a breakout setup, let it go. The market is infinite; there will always be another trade opportunity tomorrow.
Revenge Trading
You just took a painful loss on a trade. You feel angry, insulted, and frustrated. You want your money back immediately. You instantly open another trade with double the position size, ignoring your technical strategy, purely out of spite to “beat” the market.
This is revenge trading, and it is the fastest way to completely destroy an entire account in a single afternoon. The market does not know who you are, it does not care about your feelings, and it cannot be bullied. When you take a loss, close your laptop, stand up, take a walk, and do not look at a chart until your mind is completely calm and logical again.
Common Beginner Pitfalls to Avoid
To help save you time and preserve your money, here is a list of the most frequent traps beginner traders walk into:
- Over-trading: Placing 20 or 30 trades a day because you feel like you always need to be doing something. Professional traders are patient like snipers; they wait hours or days for the perfect setup, and if it doesn’t appear, they do nothing.
- Chasing Holy Grail Indicators: Spending thousands of dollars on custom indicators, premium chat rooms, or secret algorithms looking for a tool that wins 100% of the time. It does not exist. Simple strategies work best.
- Over-leveraging: Using maximum leverage on small accounts. If you have a $500 account and use 1:50 leverage, a tiny 2% price move against you can instantly wipe out your entire account.
- Failing to Adapt to Market Conditions: Trying to use a trend-following strategy when the market is locked in a choppy, sideways consolidation pattern. You must recognize what environment the market is currently in.
Conclusion: The Long Road to Consistency
Becoming a profitable trader is not a sprint; it is an intense, long-distance marathon. It takes time, patience, and a lot of emotional resilience. Do not expect to quit your day job in three months. Treat it like a university degree or learning a complex craft like surgery or law.
Focus first on mastering your discipline, logging your data, and protecting your capital. If you can protect your downside, your upside will naturally take care of itself. Stay patient, keep your losses small, and enjoy the educational journey.
Frequently Asked Questions (FAQs)
1. How much money do I need to start trading as a beginner?
You can technically start with as little as $50 to $100 with brokers that offer micro-lots or fractional shares. However, to practice realistic risk management, starting with $500 to $1,000 is ideal. Never trade with money you cannot afford to lose.
2. Can I start trading while keeping a full-time 9-to-5 job?
Yes. Swing trading is perfectly suited for professionals. You can spend 30 minutes in the evening looking at daily charts, setting up your entry and stop-loss orders, and let them run automatically during the day without needing to watch the screen.
3. What is the difference between short-term trading and long-term investing?
Trading focuses on capturing short-term price swings over minutes, days, or weeks using technical charts. Investing involves buying assets to hold for many years based on corporate health, compounding returns, and economic growth.
4. Is trading a safe way to build a reliable monthly income?
No, trading income is highly variable. Even professionals experience losing weeks or months. It should be viewed as a skill to grow capital over time rather than a reliable substitute for a steady salary.
5. Why do most retail traders lose money in the market?
Most beginners lose money due to a complete lack of risk management (risking too much capital per trade), emotional decisions driven by FOMO, and revenge trading after taking losses.
6. What is a stop-loss order and why is it mandatory?
A stop-loss order automatically closes out your trade at a predetermined price if the market moves against you. It is mandatory because it caps your maximum financial risk and protects your account from catastrophic losses.
7. Which financial market is the absolute best for beginners to learn on?
The stock market or major Forex currency pairs (like EUR/USD) are generally best for beginners. They have high liquidity, clean price trends, and significantly lower volatility compared to cryptocurrencies.
8. What is leverage in trading and how does it work?
Leverage is capital borrowed from your broker to control a larger trade position. For example, 1:10 leverage turns $100 of your cash into $1,000 of buying power. It magnifies both your potential profits and your potential losses.
9. How long does it typically take to become a profitable trader?
For most people who practice consistently, keep a journal, and stick to a strict risk management framework, it takes between 1 to 3 years to achieve steady, reliable profitability.
10. Do I need a formal university degree in finance to trade?
No. Financial markets are open to anyone. While a background in math, economics, or statistics can help, most successful retail traders are entirely self-taught using online documentation, books, and deliberate practice.
11. What is the difference between a market order and a limit order?
A market order executes your trade instantly at the best available current market price. A limit order only executes your trade if the asset’s price hits a specific target price that you set in advance.
12. What is the spread in financial trading platforms?
The spread is the price difference between the highest buying price (Bid) and the lowest selling price (Ask). It acts as a built-in transaction fee collected by your broker.